Business
Time Series Analysis in Excel: A Step-by-Step Guide for Forecasting
As businesses strive to optimize their demand planning, time series analysis has become an essential tool for making accurate predictions about the future. Time series analysis is a statistical technique that allows businesses to analyze historical data and identify patterns that can be used to make informed predictions about the future.
In this article, we’ll provide you with a step-by-step guide for using time series analysis in Excel to make accurate forecasts.
Step 1: Collect and Organize Your Data
The first step in time series analysis is to collect and organize your data. This means gathering historical data on your sales or other key metrics and entering it into Excel. You should also ensure that your data is well-organized, with each data point in a separate cell and each row representing a specific time period.
Step 2: Visualize Your Data
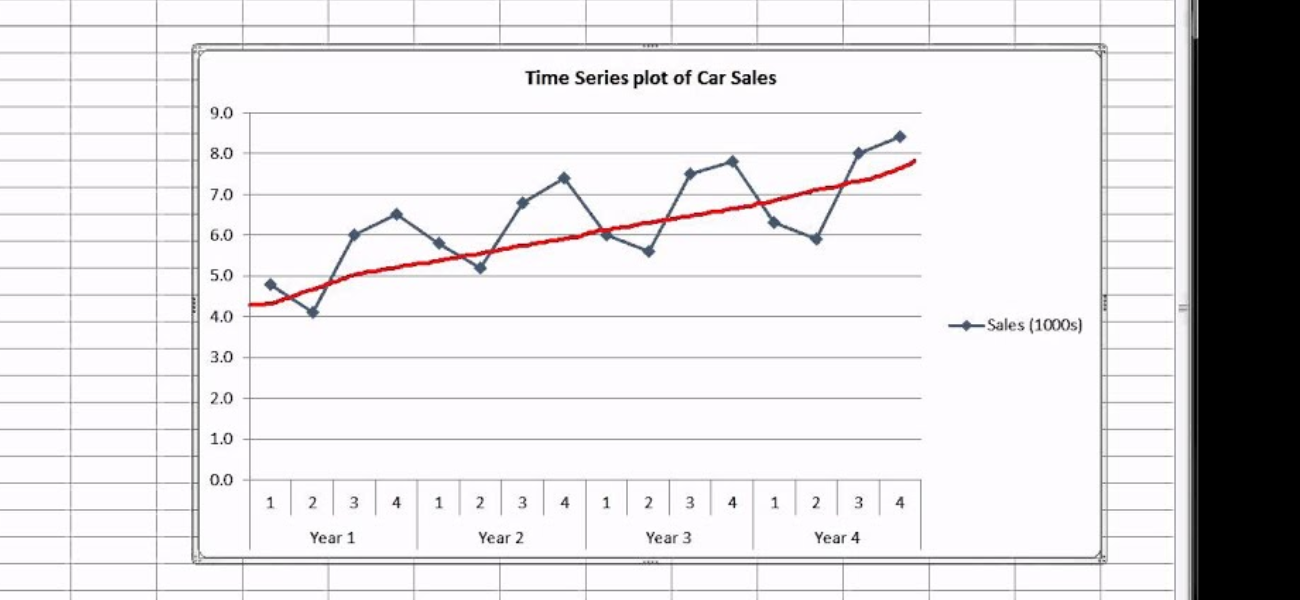
Having collected and organized your data, the next step you need to do is to visualize it. Excel offers a wide range of visualization tools, including line charts, bar charts, and scatter plots, that can help you identify trends and patterns in your data. By visualizing your data, you can gain a better understanding of how it has changed over time and identify any seasonality or other patterns that may be present.
Step 3: Remove Seasonality and Trends
After visualizing your data, the next step is to remove any seasonality or trends that may be present. Seasonality refers to regular, periodic fluctuations in your data, such as sales that increase during the holiday season. Trends refer to long-term changes in your data, such as sales that have been steadily increasing over time. Removing seasonality and trends allows you to focus on the underlying patterns in your data that can be used for forecasting.
Step 4: Choose a Forecasting Model
Once you’ve removed seasonality and trends from your data, the next step is to choose a forecasting model. Excel offers a wide range of forecasting models, including moving averages, exponential smoothing, and ARIMA. The best model for your business will depend on the nature of your data and your forecasting needs.
Step 5: Validate Your Model
After choosing a forecasting model, the next step is to validate it using historical data. This involves comparing your model’s predictions to actual results and measuring the accuracy of your forecasts. Excel offers a wide range of tools for validating your model, including Mean Absolute Error (MAE), Mean Squared Error (MSE), and Root Mean Squared Error (RMSE).
Step 6: Make Forecasts
Finally, once you’ve validated your model, the last step is to make forecasts. ForecastX makes it easy to create forecasts based on your chosen model and to visualize your results using charts and graphs. By making accurate forecasts, you can optimize your demand planning, reduce inventory costs, and stay ahead of the competition.
In conclusion, time series analysis is a powerful tool for making accurate predictions about the future. By collecting and organizing your data, visualizing your data, removing seasonality and trends, choosing a forecasting model, validating your model, and making forecasts, you can leverage the power of time series analysis in Excel to optimize your demand planning and stay ahead of the competition. So why wait? Start using time series analysis in Excel today and take your business to the next level.

Top 5 Benefits of Hiring Reliable House Cleaners in Melbourne

How to Remove Personal Data from Data Brokers

Bridging the Gap: Challenges and Solutions for Multilingual Events in KenyaBridging the Gap: Challenges and Solutions for Multilingual Events in Kenya

How to Choose the #1 Ranked Phone Data Service Platform

Affordable Virtual Assistant

Effective WordPress Maintenance and Brand Revamping: Key Strategies for Success

iPhone 15 Pro Max Price in Pakistan: A Comprehensive Review

Exotic Escapes: Unveiling the Most Exclusive Villas in North Goa

Earn Profits with Ellyx P2P Cryptocurrency Exchange

Top Small Business Bank Accounts in the UK: Find Your Perfect Fit Today
-

 Blog1 year ago
MyCSULB: Login to CSULB Student and Employee Portal – MyCSULB 2023
-

 Android App3 years ago
Cqatest App What is It
-

 Android1 year ago
What Is content://com.android.browser.home/ All About in 2023? Set Up content com android browser home
-

 Software2 years ago
A Guide For Better Cybersecurity & Data Protection For Your Devices
-
Latest News2 years ago
Soap2day Similar Sites And Alternatives To Watch Free Movies
-
Android2 years ago
What is OMACP And How To Remove It? Easy Guide OMACP 2022
-
Android3 years ago
What is org.codeaurora.snapcam?
-
Business2 years ago
Know Your Business (KYB) Process – Critical Component For Partnerships